


This feature is only available to premium members
Check out our Premium Accounts
Select your Account Type
I'm a Parent Add up to 6 children
Premium Account Required
Premium Account Required
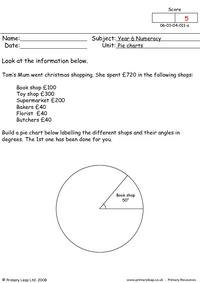
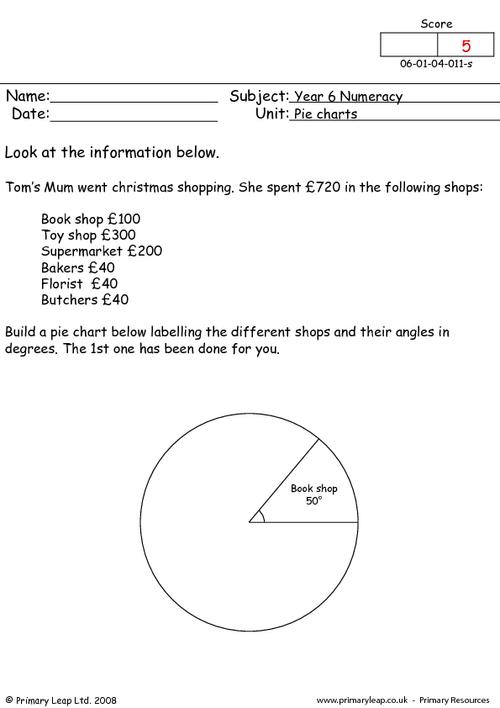
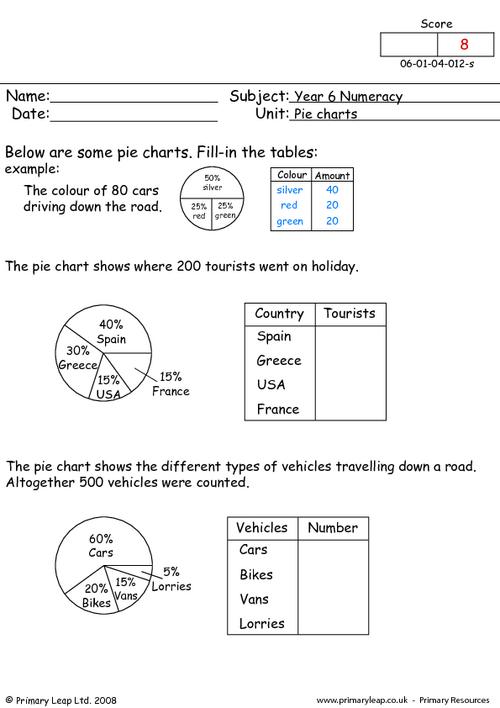
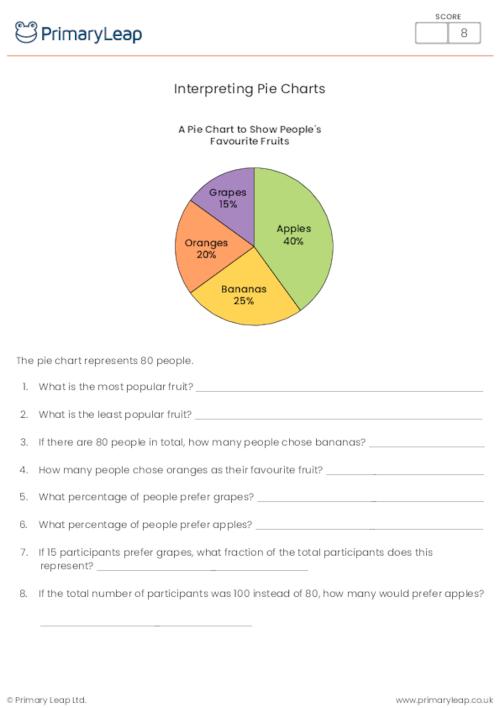
Interpreting Pie Charts
This worksheet is designed to engage students in exploring data visualization through a pie chart. Students will work with data representing the favorite fruits of a group of participants. They will interpret the data in the form of a pie chart and answer questions related to the chart.
Pupils will:
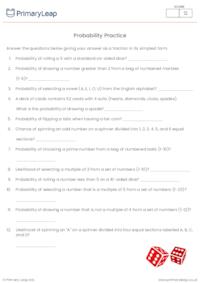
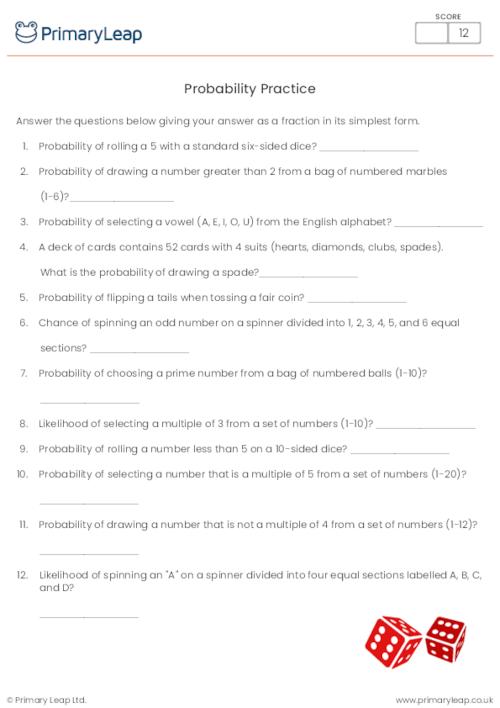
Probability WorksheetThis worksheet is designed to help students understand and practise calculating

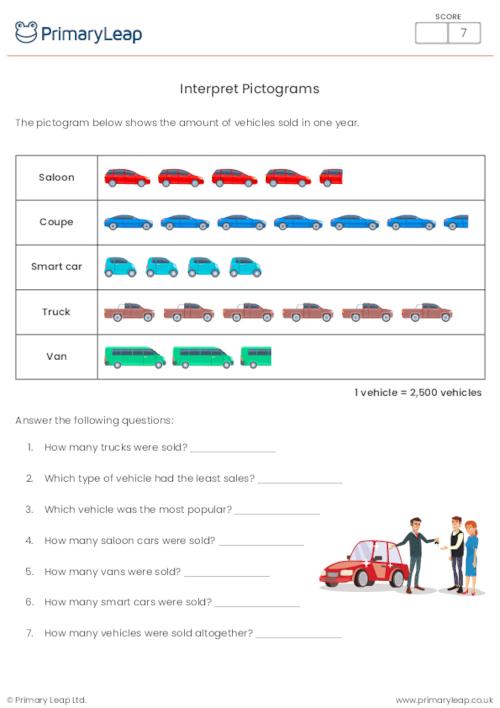
Students look at the information on the pictogram and answer the accompanying questions.
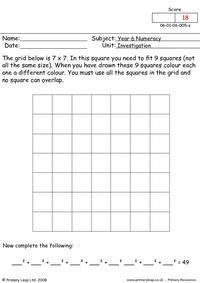
Students follow the instructions with this fun maths puzzle.
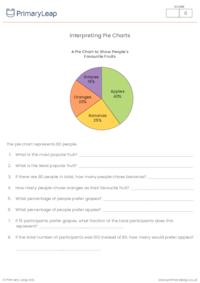
Interpreting Pie ChartsThis worksheet is designed to engage students in exploring data visualization
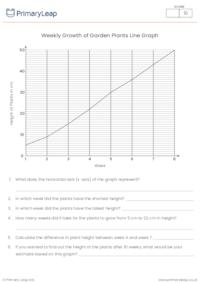
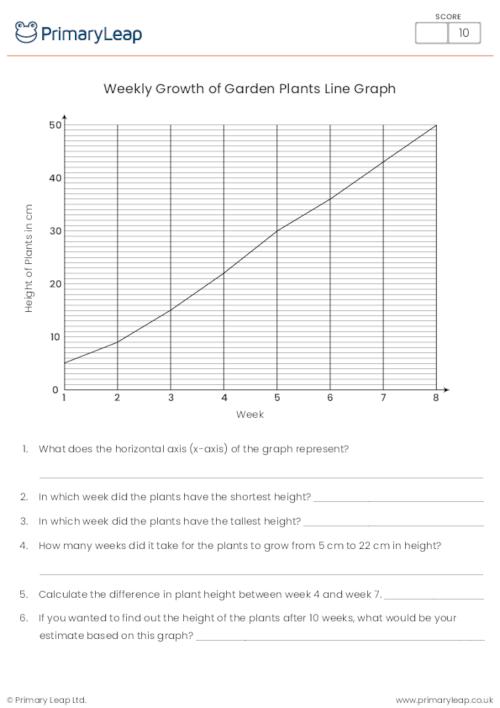
Weekly Growth of Garden Plants Line Graph ActivityUse this worksheet to help students practise inter
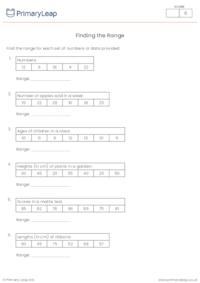
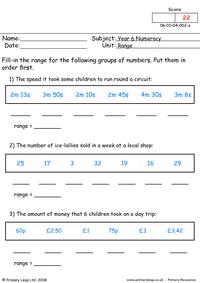
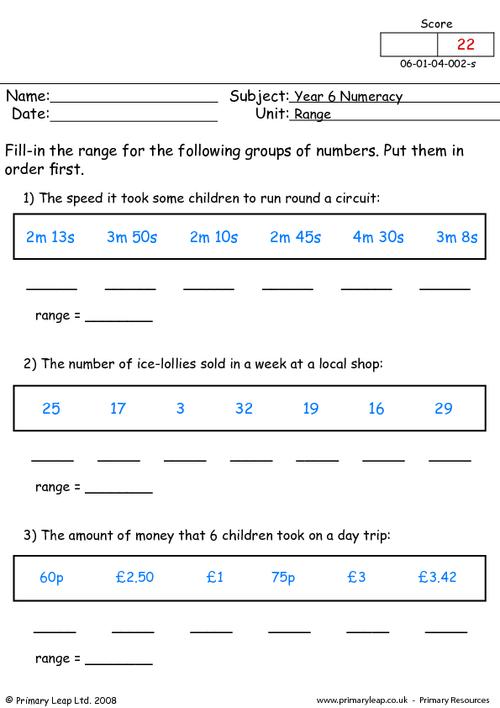
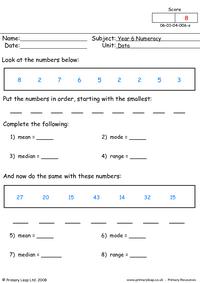
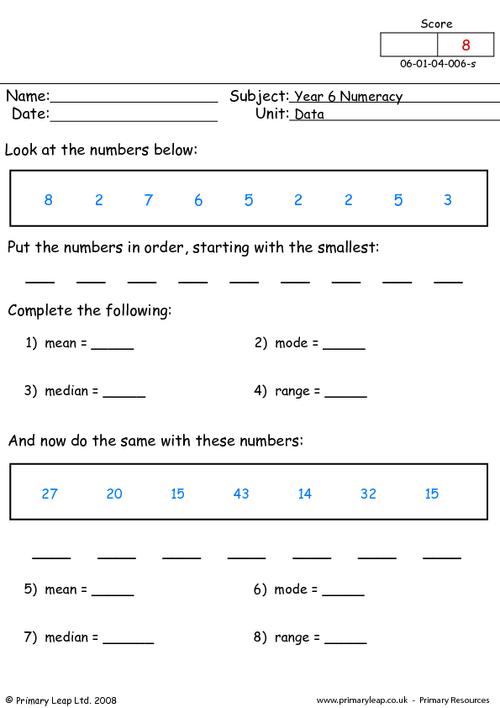
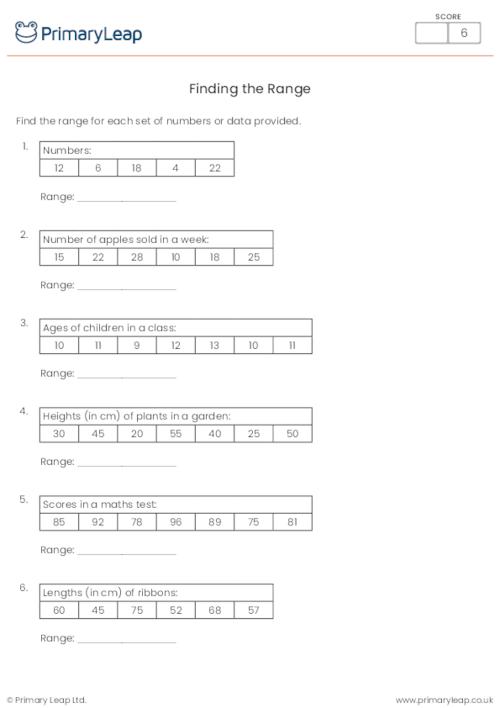
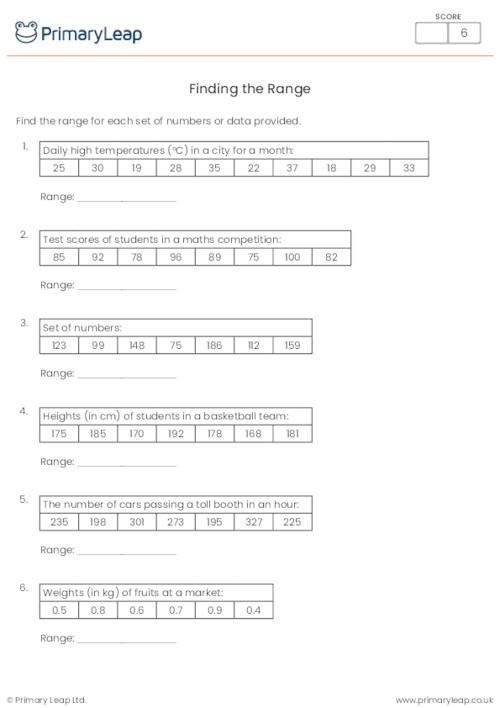
Practising RangeUse this worksheet to help students practise the concept of "range," which is the di
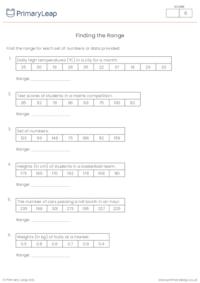
Use this worksheet to help students deepen their understanding of the concept of "range." Range is t
This worksheet is intended for use in the classroom, as a homework assignment, or as part of a large
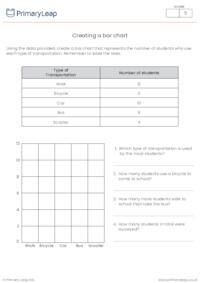
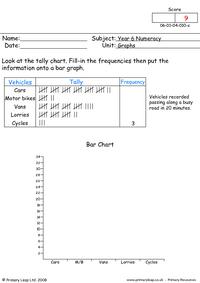
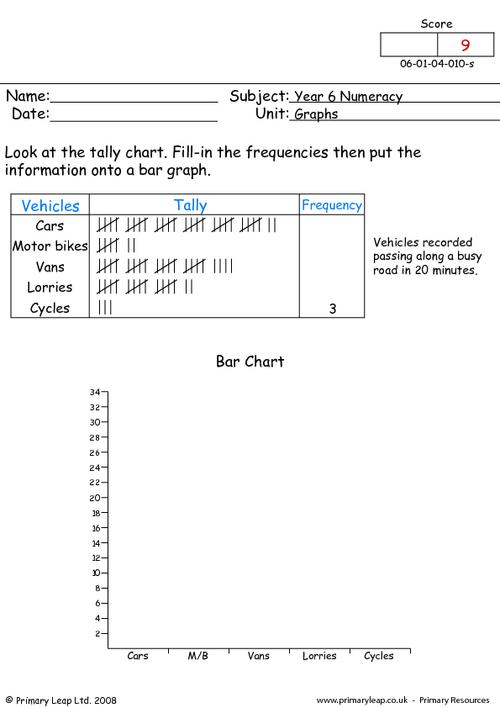
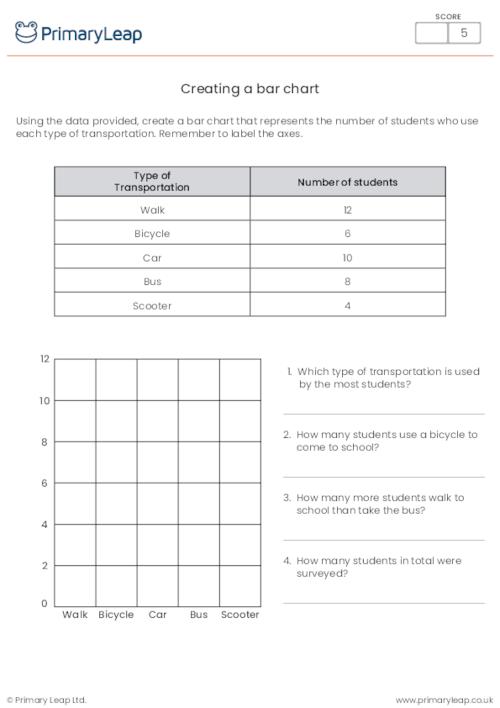
Creating a Bar ChartThis worksheet aims to engage students in the process of creating a bar chart ba
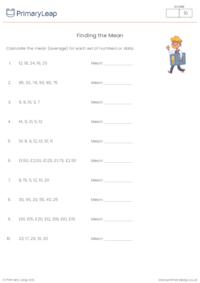
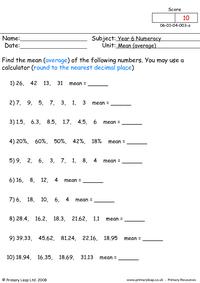
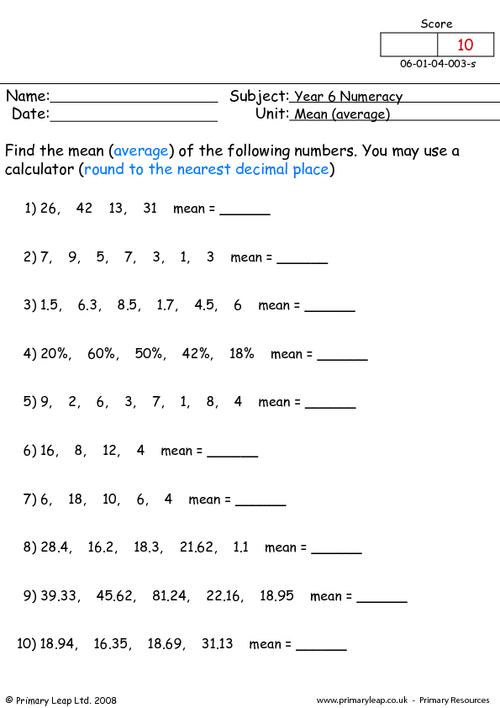
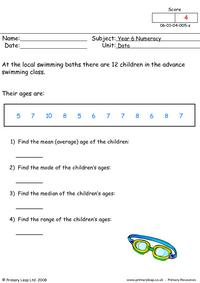
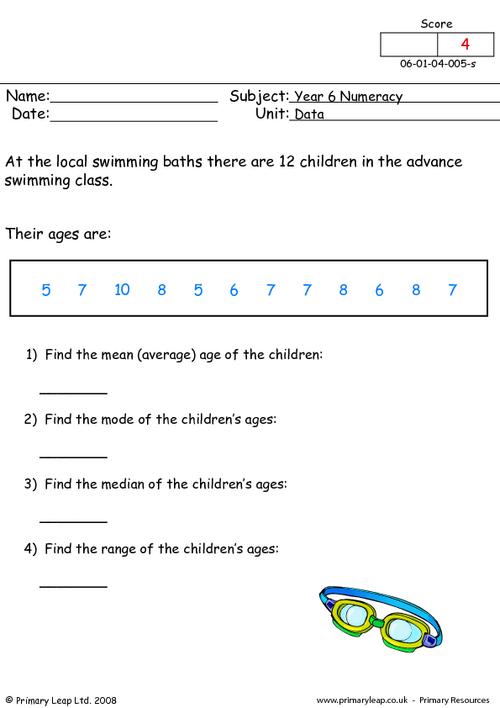
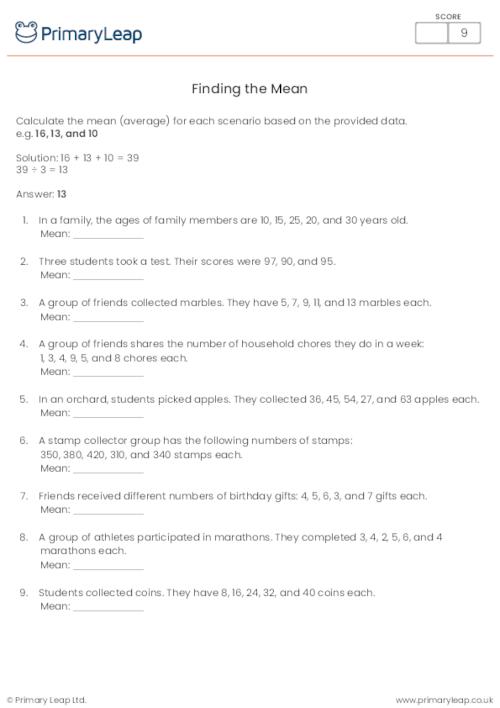
Finding the MeanThis handy worksheet will help students practise and master the skill of finding the
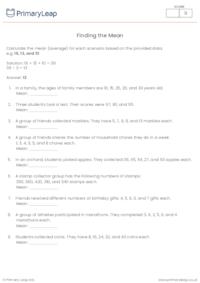
Finding the Mean with ScenariosThis worksheet iprovides Year 6 students with opportunities to practi

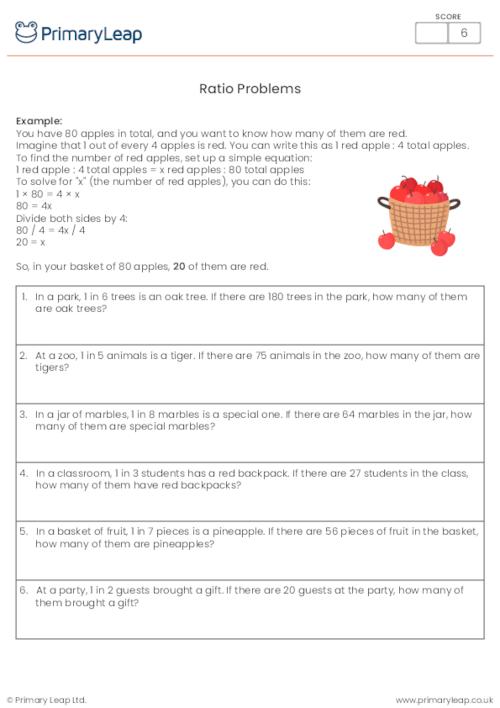
Ratio problems worksheetThis Year 6 math worksheet focuses on ratios and proportions, specifically d
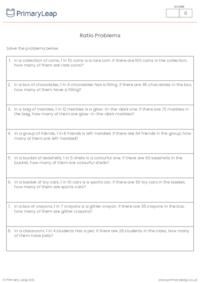
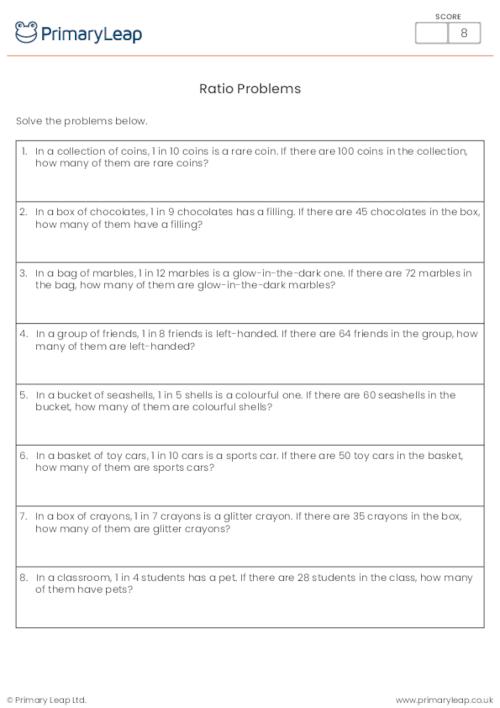
Ratio problems worksheetThis maths activity focuses on ratios and proportions, specifically designed

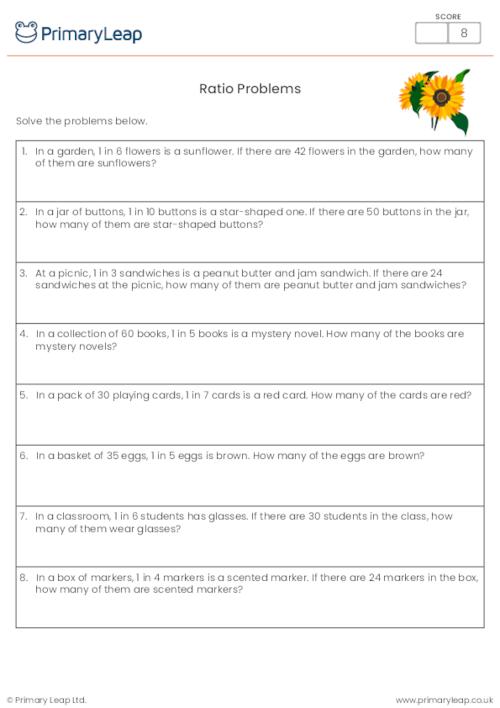
Ratio problems worksheetThis maths resource focuses on ratios, specifically designed to help student
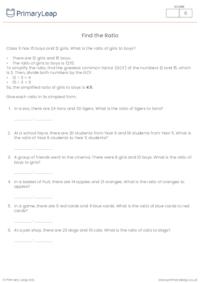
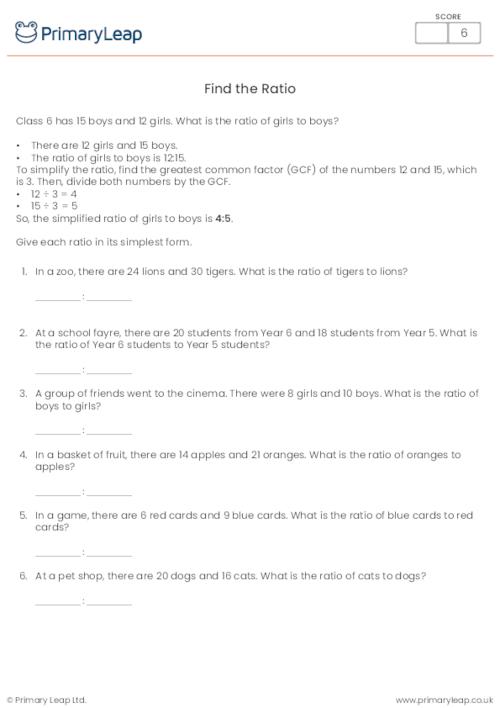
Find the RatioThis maths worksheet is tailored to reinforce students' understanding of ratios and pr
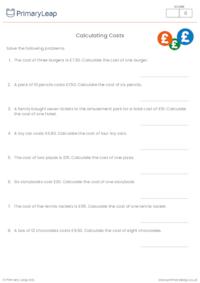
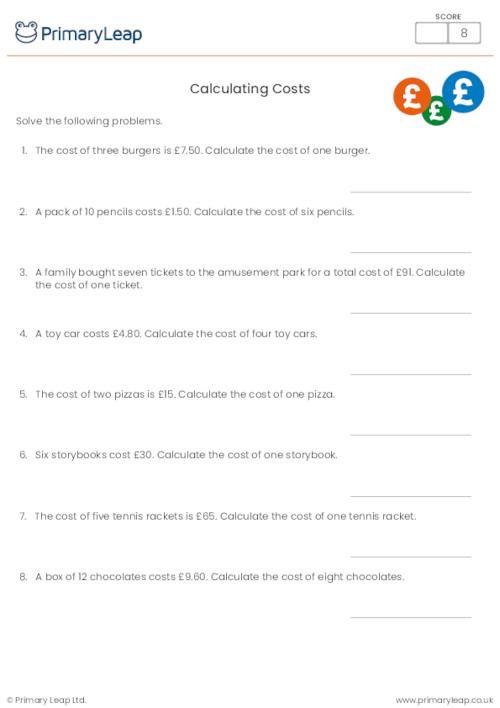
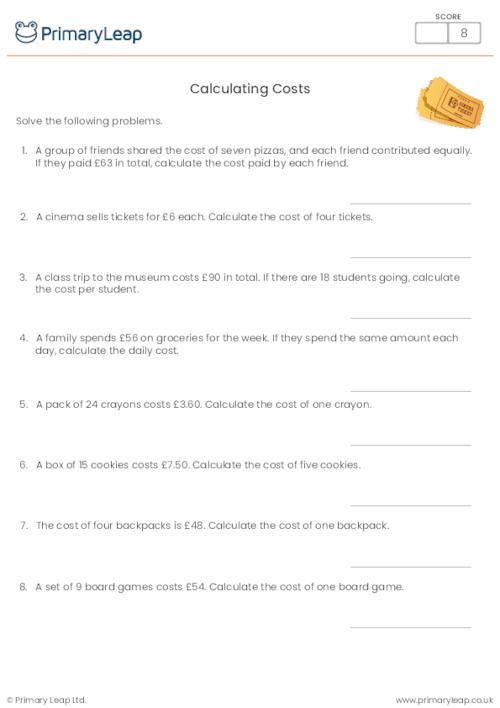
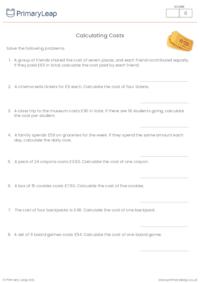
Calculating costs activityWith this maths worksheet, students will solve problems related to calcula
How will this worksheet help my child?This maths worksheet focuses on developing students' skills in
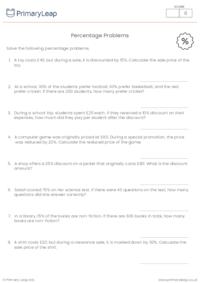
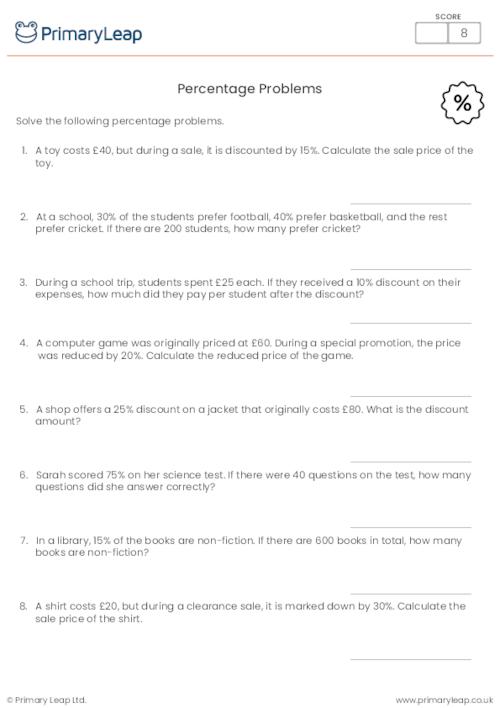
How will this worksheet help students?This year 6 maths worksheet on percentage problems will help s
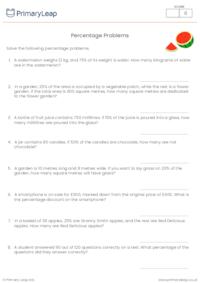
Percentage problems activityThis Year 6 math worksheet is designed to help students practice solving
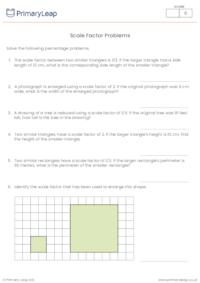
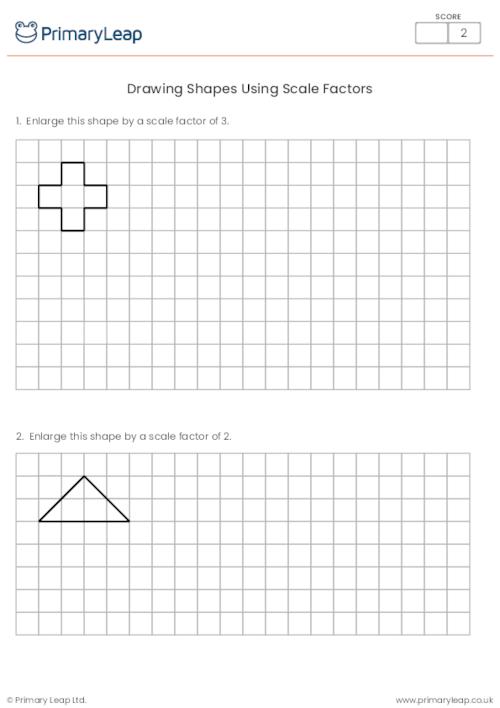
Shapes and Scale FactorsThis handy maths worksheet is designed to help students grasp the concept of
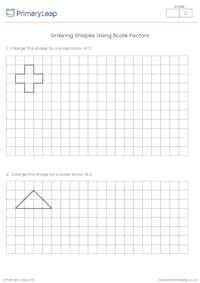
How will this worksheet help my child?With this handy maths worksheet, students will practise drawin
An email has been sent to your account please activate your account to continue.

Select your Account Type
I'm a Parent Add up to 6 children
PrimaryLeap has introduced a new interactive learning platform and would like to offer you a completely Free Upgrade.
We understand that you may only want to use our services for worksheets and may not want to upgrade your account.
But if you are interested in trying out our new services then you're just a click away.


An email has been sent to your account please activate your account to continue.
You've answered
and have 2 Questions remaining
Import multiple students information through a CSV File. Browse or drag .CSV file below.