


This feature is only available to premium members
Check out our Premium Accounts
Select your Account Type
I'm a Parent Add up to 6 children
Premium Account Required
Premium Account Required
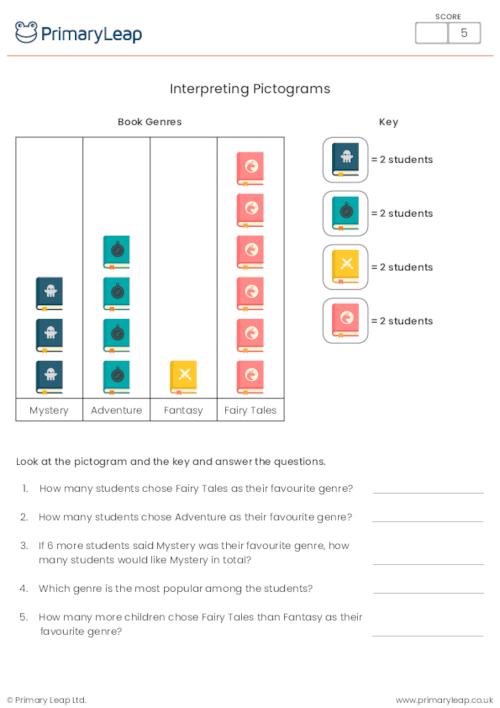
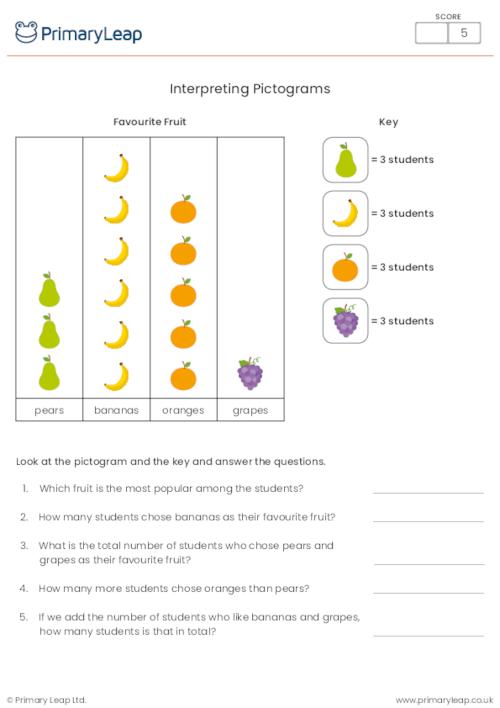
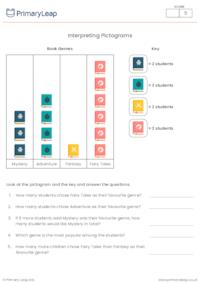
Interpreting Pictograms
This maths worksheet is a fun and engaging activity designed to help students practise data representation and interpretation through the use of a pictogram. The worksheet focuses on students' favourite fruits, a topic that is relatable and interesting for young learners. The worksheet provides a colourful pictogram with images of four different fruits: pears, bananas, oranges, and grapes. Each fruit icon represents a certain number of students who chose it as their favourite.
Learning Objectives:
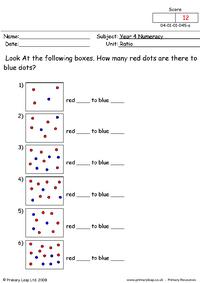
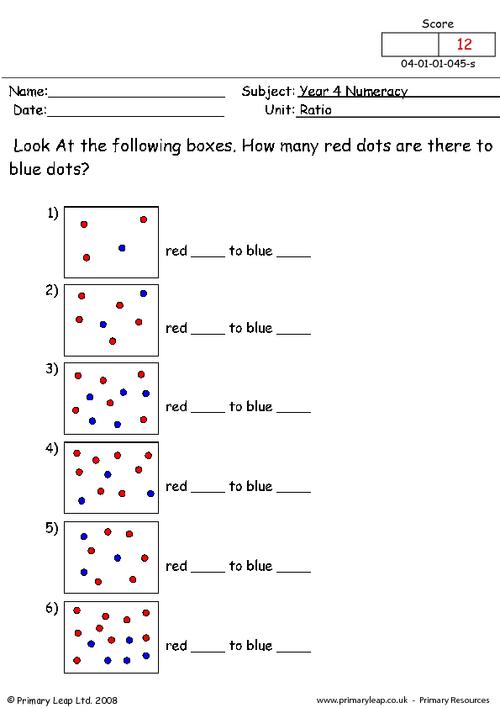
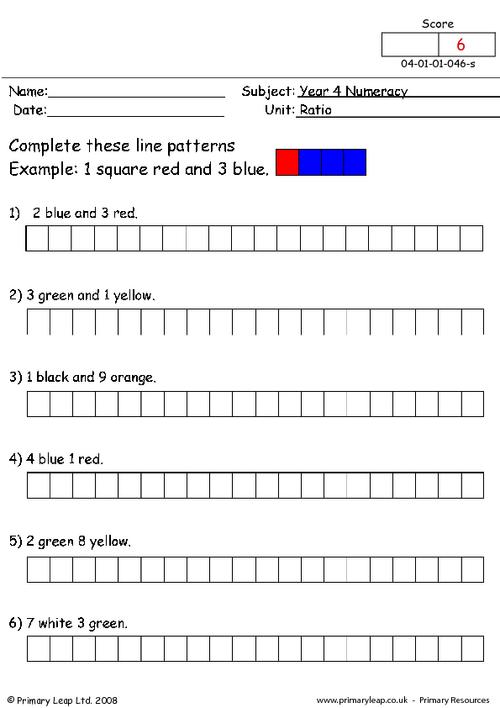
Year 4 Maths: Ratio - Ratios are used to make comparisons between two things. Children are asked how
Year 4 Maths: Ratio - Ratios are used to make comparisons between two things. Children are asked to
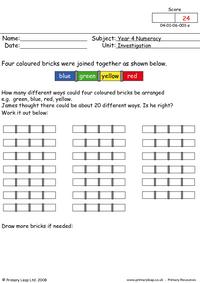
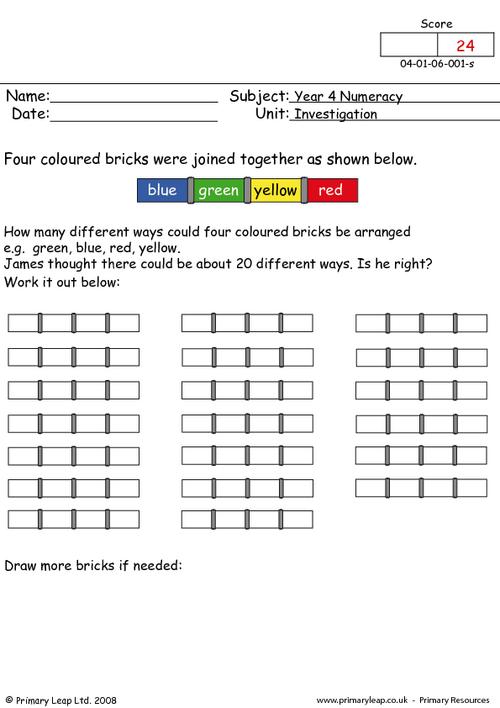
Year 4 Maths: Maths investigation - This maths investigation involves working out how many ways four
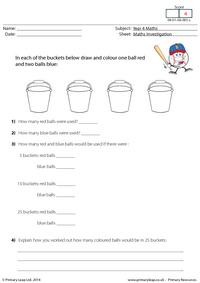
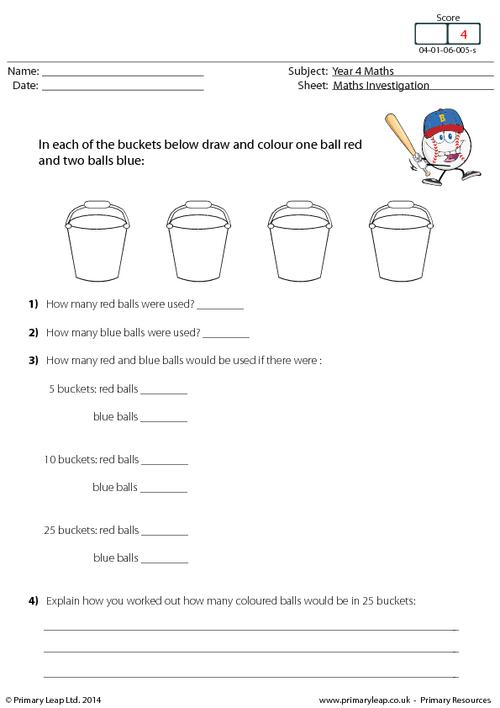
This maths investigation asks students to draw and colour one ball red and two balls blue in each of
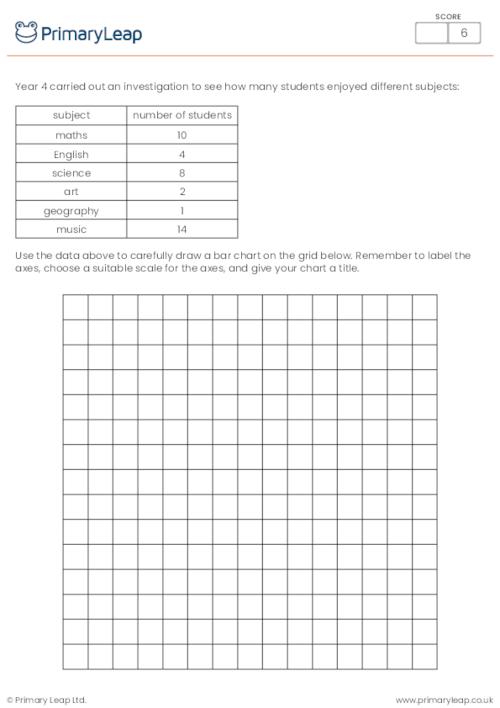
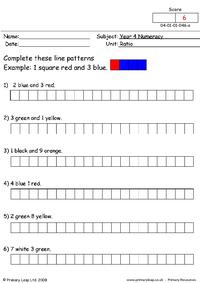
This maths worksheet for year 4 students will help children develop their understanding of how to re

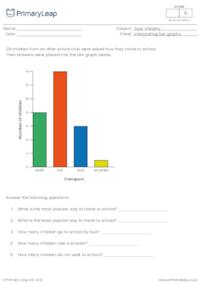
Bar charts - Presenting dataYear 4 Statistics:interpret and present discrete and continuous data usi
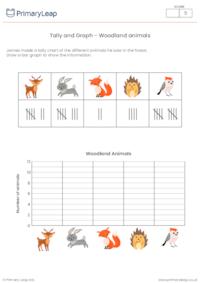
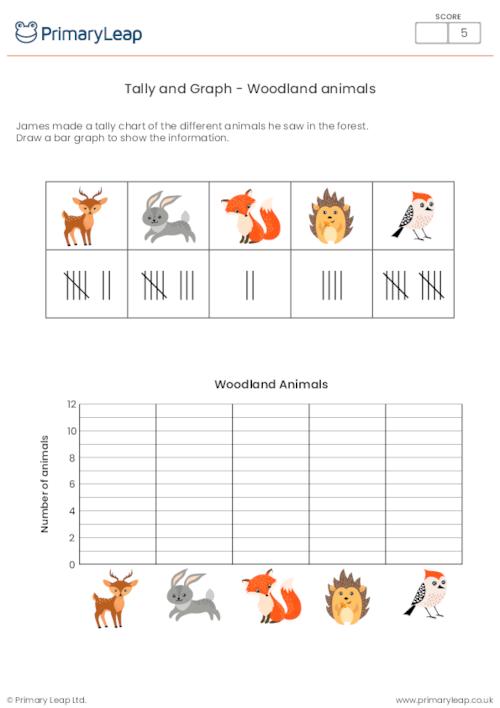
Tally and Graph - Woodland animalsThis worksheet is designed to help students grasp the fundamentals
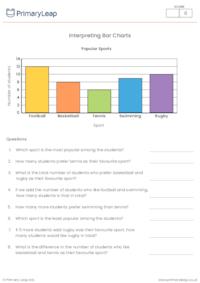
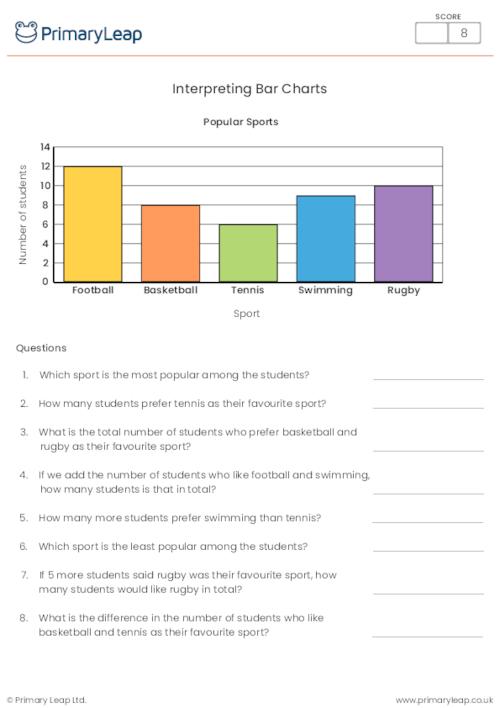
Interpreting Bar ChartsThis worksheet encourages students to explore data representation, make compa

Interpreting PictogramsThis maths worksheet is a fun and engaging activity designed to help students
This handy maths worksheet is designed to introduce students to the concept of pictograms while expl
An email has been sent to your account please activate your account to continue.

Select your Account Type
I'm a Parent Add up to 6 children
PrimaryLeap has introduced a new interactive learning platform and would like to offer you a completely Free Upgrade.
We understand that you may only want to use our services for worksheets and may not want to upgrade your account.
But if you are interested in trying out our new services then you're just a click away.


An email has been sent to your account please activate your account to continue.
You've answered
and have 2 Questions remaining
Import multiple students information through a CSV File. Browse or drag .CSV file below.