Printable primary worksheets
All of our resources come complete with answer sheets to save time for busy teachers and parents. Input your child’s scores and keep track of your child's progress.
worksheet plans from £3.20/monthAll of our resources come complete with answer sheets to save time for busy teachers and parents. Input your child’s scores and keep track of your child's progress.
worksheet plans from £3.20/month
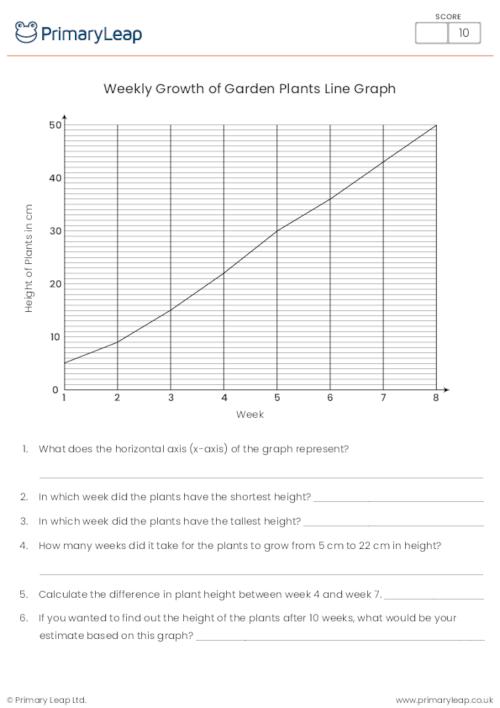
Weekly Growth of Garden Plants Line Graph ActivityUse this worksheet to help students practise interpreting data from a line graph. Students will analyze a line graph representing the weekly growth of plants in a garden and answer questions related to the graph. This worksheet can be used in the classroom, as a homework assignment, or as part of a larger unit on data analysis and interpretation. It aims to improve students' skills in reading and understanding line graphs while engaging them with real-world data related to plant growth. There are 10 questions for students to answer.
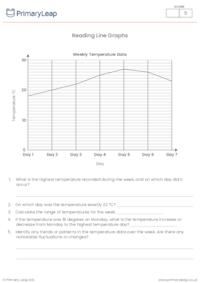
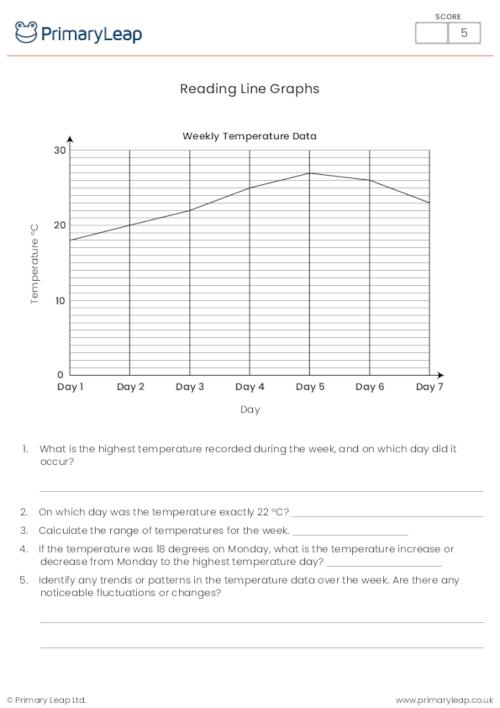
Reading Line GraphsUse this handy worksheet to help students practise interpreting and analysing data presented in a line graph. The line graph displays temperature data over the course of a week. Students will engage with the graph to answer questions that require them to identify temperature trends, extremes, and averages within the dataset. This worksheet can be used effectively in the classroom for interactive learning. Educators can provide guidance and facilitate discussions as students work on the questions. It is also suitable for homework assignments, allowing students to practise their data analysis skills independently. This activity can be a valuable addition to the curriculum for reinforcing data analysis and visualisation skills, both in the classroom and as homework.

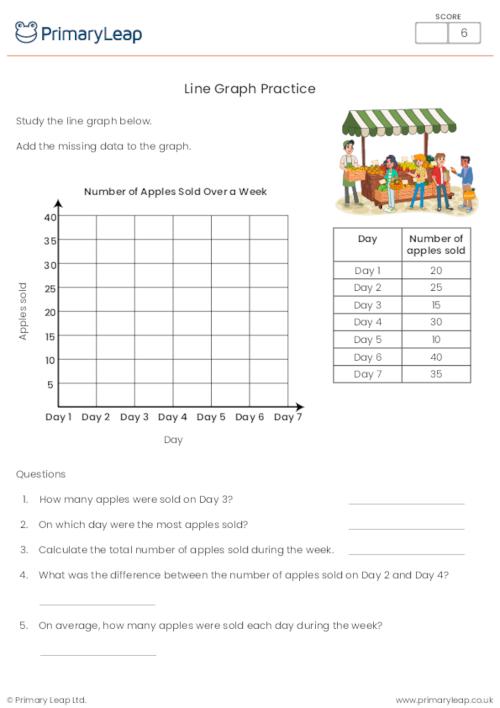
Line Graph PracticeThis worksheet helps students improve their skills in interpreting and creating line graphs. By using the example of apples sold over a week, students will enhance their abilities to collect and represent data. After completing the graph, students will answer questions to assess their understanding. These questions include interpreting data, identifying the day with the most sales, finding the total apples sold, comparing sales on specific days, and calculating the average daily sales. This maths resource can be used in class, for homework, or as part of a broader unit on data handling and graphs.


Check out our ready-to-use worksheets that can be used in the classroom or at home. Simply download or print and watch your child’s confidence grow with our easy to follow printables.


One of the best things about printable worksheets is that they make learning fun and easy. Explore our educational resources based on and keep your children learning through these fun and engaging exercises.


Our printable worksheets are designed for progressive learning. Our engaging content enables a child to learn at their own speed and gain confidence quickly. When we help a child believe in themselves, we empower them for life.


Printable worksheets are a great way to enhance creativity and improve a child’s knowledge. Help your child learn more about with this great selection of worksheets designed to help children succeed.
An email has been sent to your account please activate your account to continue.


Select your Account Type
I'm a Parent Add up to 6 children
PrimaryLeap has introduced a new interactive learning platform and would like to offer you a completely Free Upgrade.
We understand that you may only want to use our services for worksheets and may not want to upgrade your account.
But if you are interested in trying out our new services then you're just a click away.


An email has been sent to your account please activate your account to continue.
You've answered
and have 2 Questions remaining
Import multiple students information through a CSV File. Browse or drag .CSV file below.